fenaco annual report The annual report of the fenaco cooperative as a website of its own each year: key figures at a glance, strategy as a graphic, stories from across the group, in German and French.
fenaco is the agricultural cooperative behind LANDI, Volg and AGROLA. Its annual report has two audiences: members and media who want to know in three minutes how the year went, and everyone who reads on.
Read moreLess
In autumn 2020, Liip showed fenaco three ideas for a digital annual report, with me responsible for art direction and design. I have designed the report online every year since the 2020 edition. It starts from the printed edition: together with corporate communications we decide what belongs online and cut it down to the essentials. Each year this becomes a website of its own in Readymag, in German and French. Anyone who wants everything downloads the full report.
An annual report gets 5 to 15 minutes
Starting point
A third of readers spend only 5 to 15 minutes on an annual report, as studies on corporate reporting show. For relevant, well-made content, though, they take their time. In the pitch we proposed three routes: the report as part of fenaco.com in the existing CMS, a thoroughly digital longread, and in between the «Sneak Peek». fenaco chose the Sneak Peek: the highlights appear as a website of their own, with moving images and animated graphics; figures and background are in the full report to download. Because the website is built without a CMS integration, it can tell a new story every year at a manageable cost.
Numbers first, then the story
Key figures
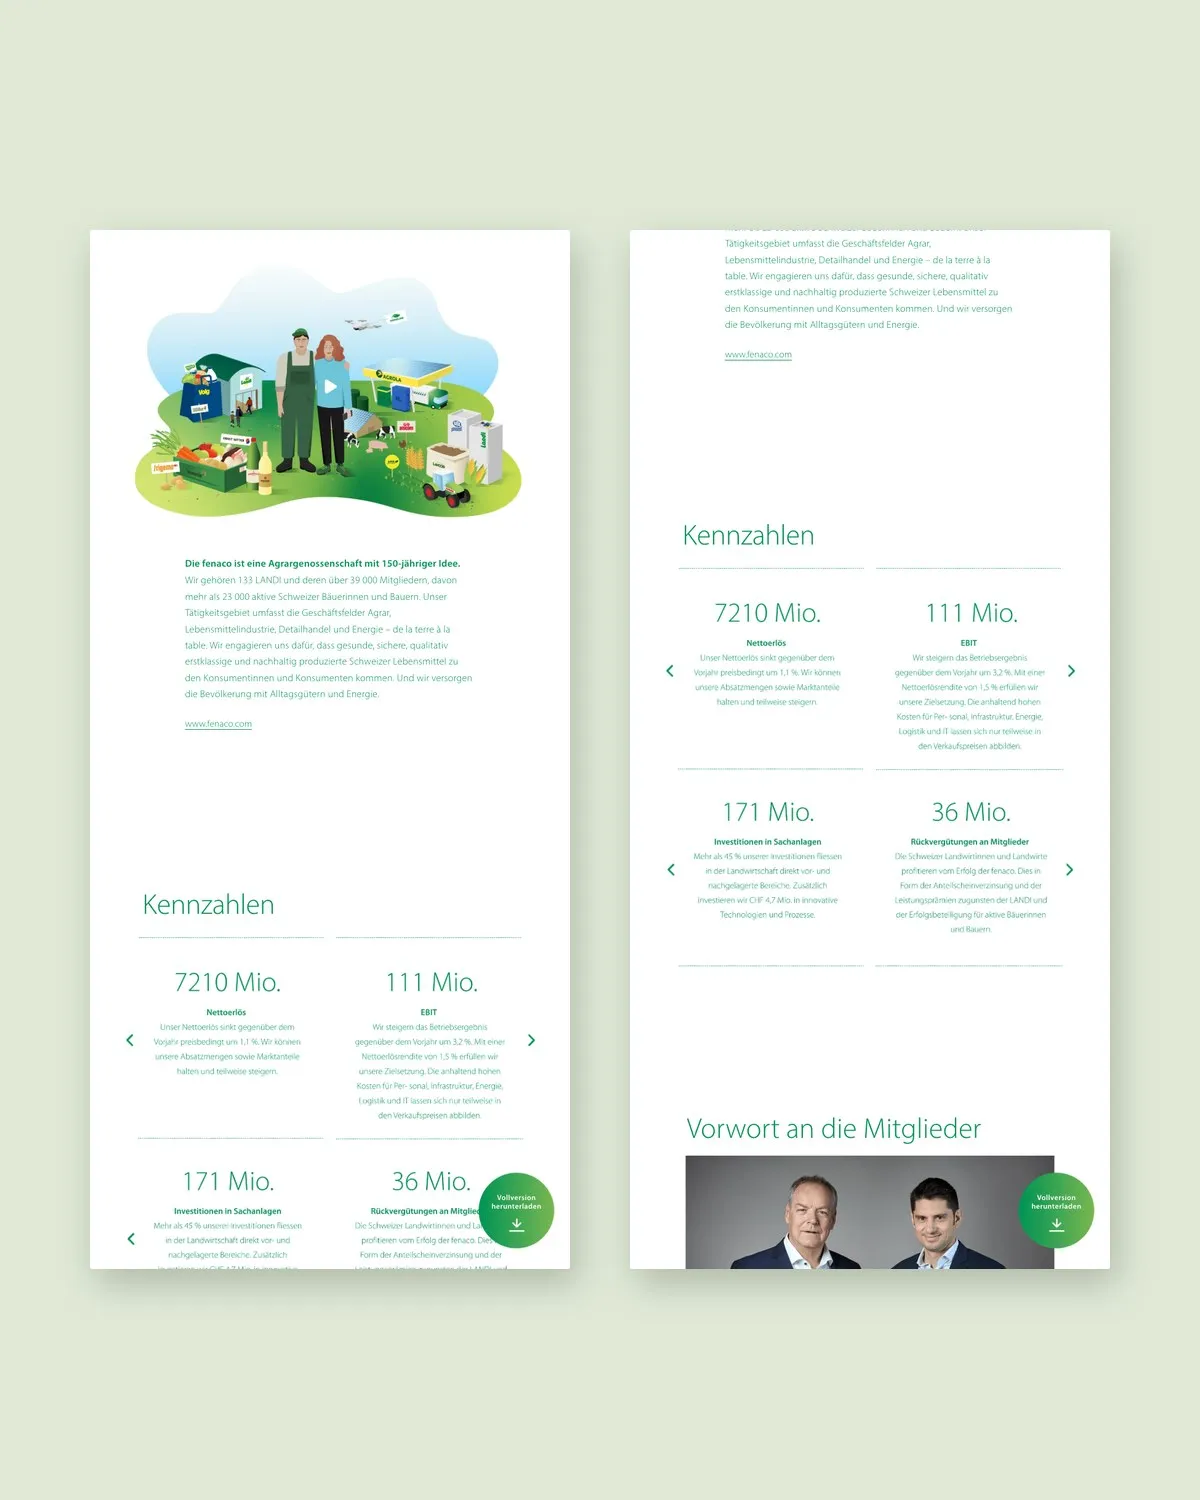
Right after the opening, an illustration shows who fenaco is: four business areas, from farm and field to shop and petrol station, in a single picture. Then come the key figures. Net revenue and EBIT come first, followed by equity ratio, share capital, member refunds, investments, employees and sustainability targets: two side by side, set large, with a sentence or two of explanation. Anyone who only needs those is done after a few screens.
A year in months, not chapters
Year in review
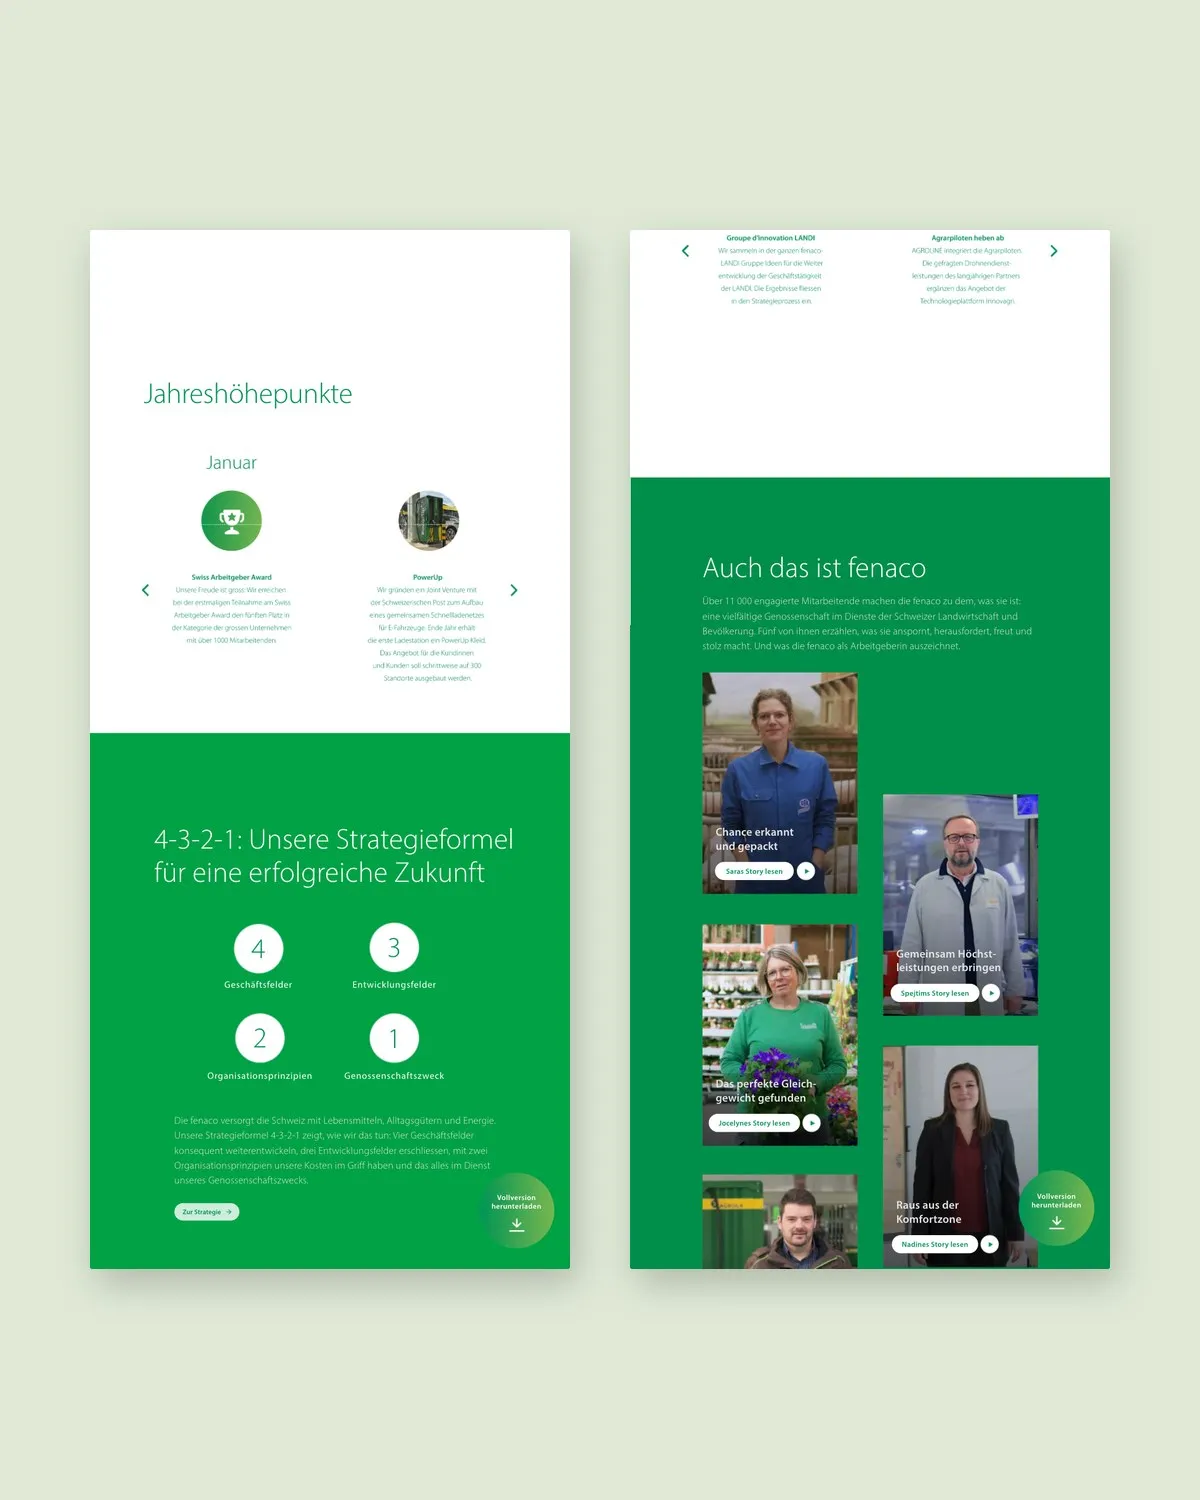
The highlights run as a month-by-month strip with a pictogram, image and short text. People from the group join in: in 2024, employees tell what they do under «Auch das ist fenaco».
Showing the strategy through real examples
Stories
In 2025 fenaco put its strategy into the formula «4-3-2-1». The report shows it as a graphic and then leads to four insights: a wild bird food maker in Austria that has just joined fenaco, drones for healthy soils, a charging park for electric trucks and a hub for food start-ups. Each insight has its own illustration and leads to a page of its own.
A fixed framework, a new section every year
Over the years
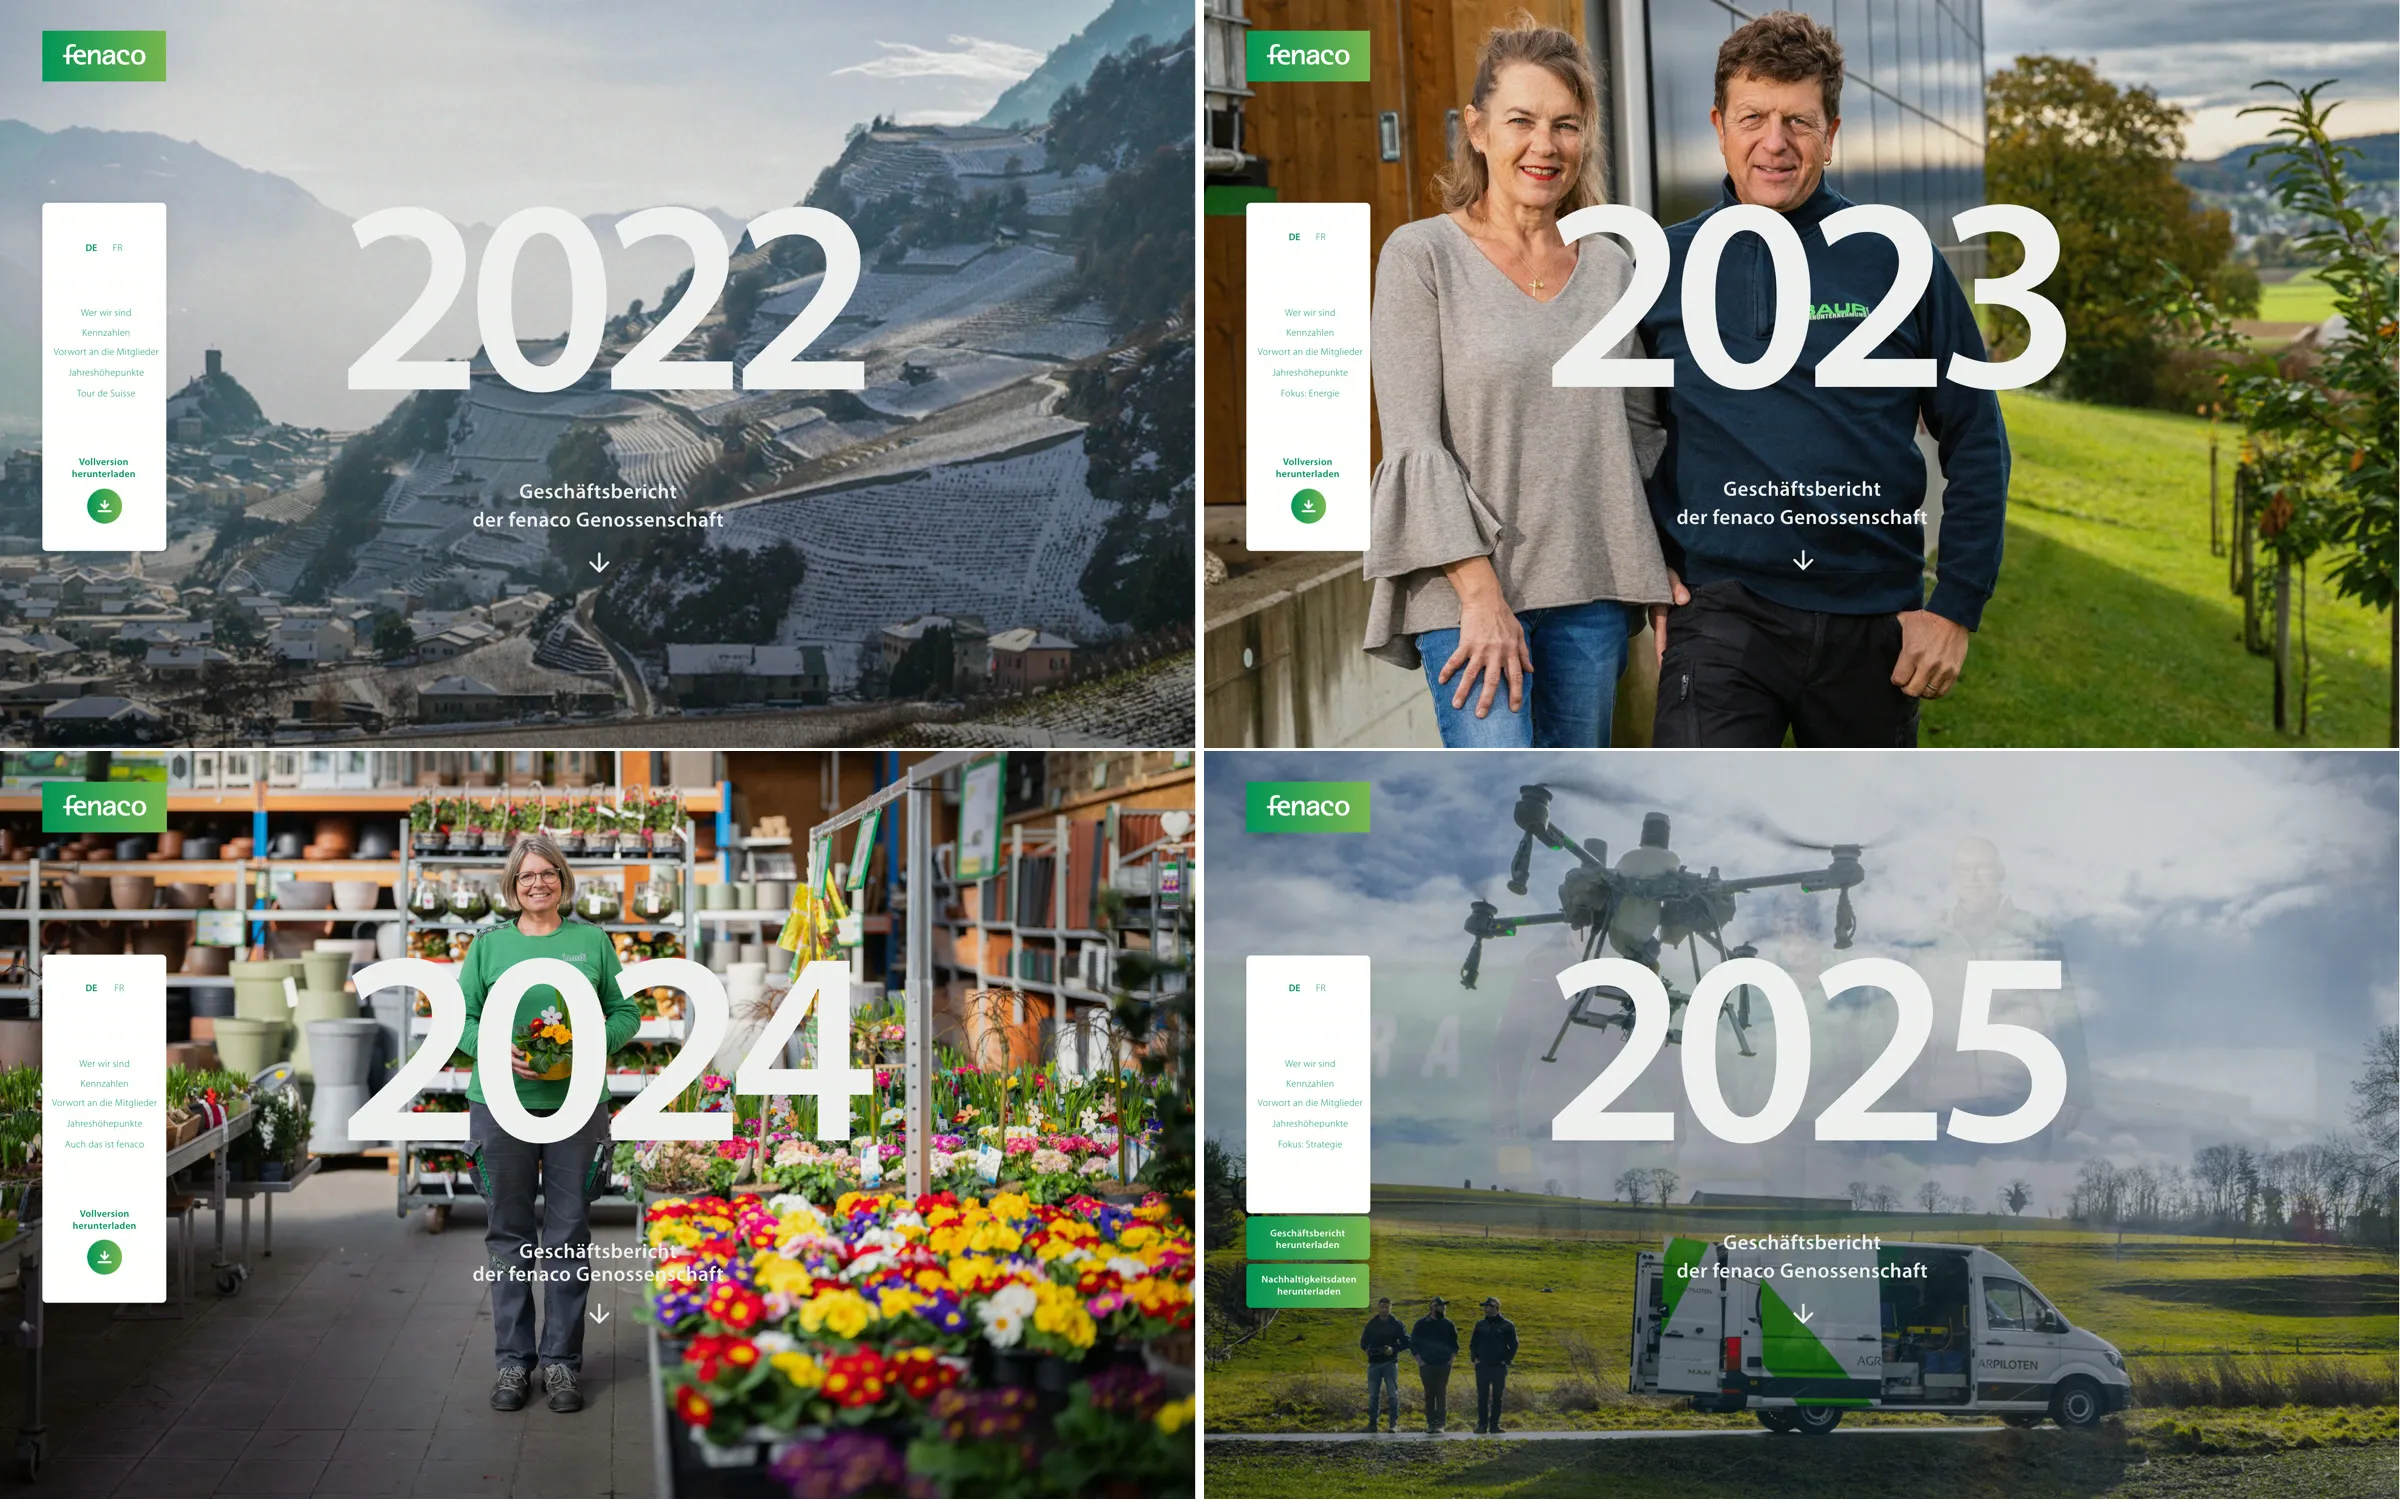
The concept after the pitch: a framework that stays the same every year, with a large year over a photo, «Who we are», key figures, foreword and highlights of the year. Members and media find their way around straight away, and the figures can be compared year on year. On top of that comes a new section each year on the topic that mattered most that year: in 2021 the dialogue between town and country, in 2022 security of supply, in 2023 energy, in 2024 the employees, in 2025 the strategy.
Each year this section gets a form of its own, and I set it in motion: fenaco's illustrations are animated, a map builds up as you scroll. The movement guides readers through the story rather than just decorating it.