Case
Agenda 2030
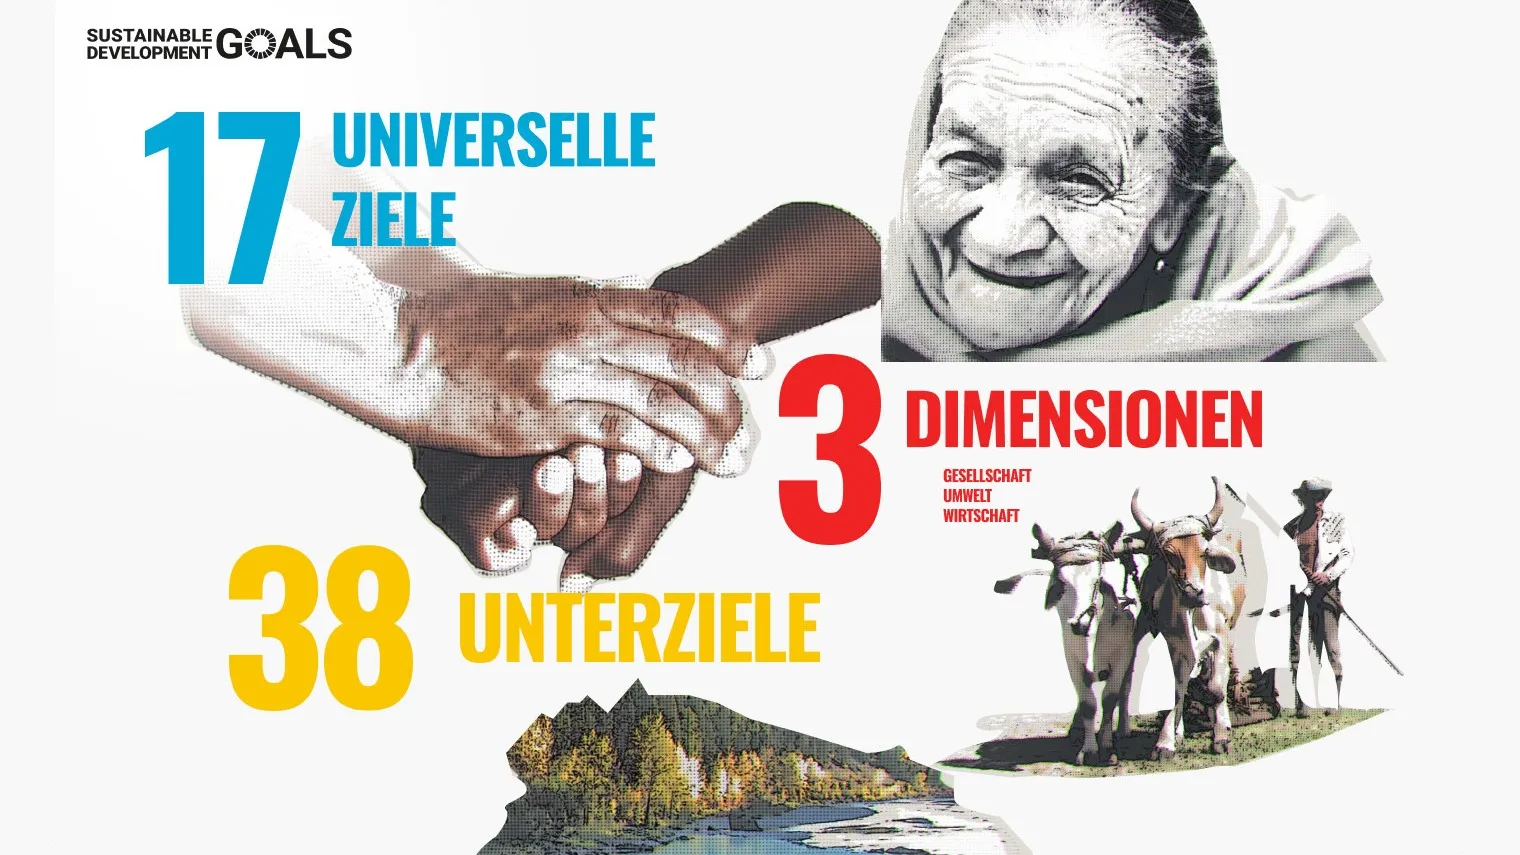
Concept and design for the website on Switzerland’s 17 Sustainable Development Goals.
Annual reports, magazines, brochures and data visualisation – print and digital from one hand, so that numbers and stories are understood.
An annual report has two audiences: those who read all of it, and those who want to know in three minutes what mattered. Good design serves both – with a clear structure, key figures you grasp at a glance, and stories that explain the numbers.
Every number needs a sentence, every sentence needs a place.
I do not design the report twice. I design it once as a system: the same grid, typography and graphics for the printed edition, the online version, the press release and the presentation. Since 2018 I have accompanied the digital annual report of a large Swiss cooperative this way.
Complex relationships – a strategy, sustainability targets, a value chain – become a graphic family: one logic, many outputs. The result is graphics that speak the same language in the report, on the website, on social media and on slides, and that can be updated with new values every year.
Elements I work with
and more
Case
Concept and design for the website on Switzerland’s 17 Sustainable Development Goals.
Case
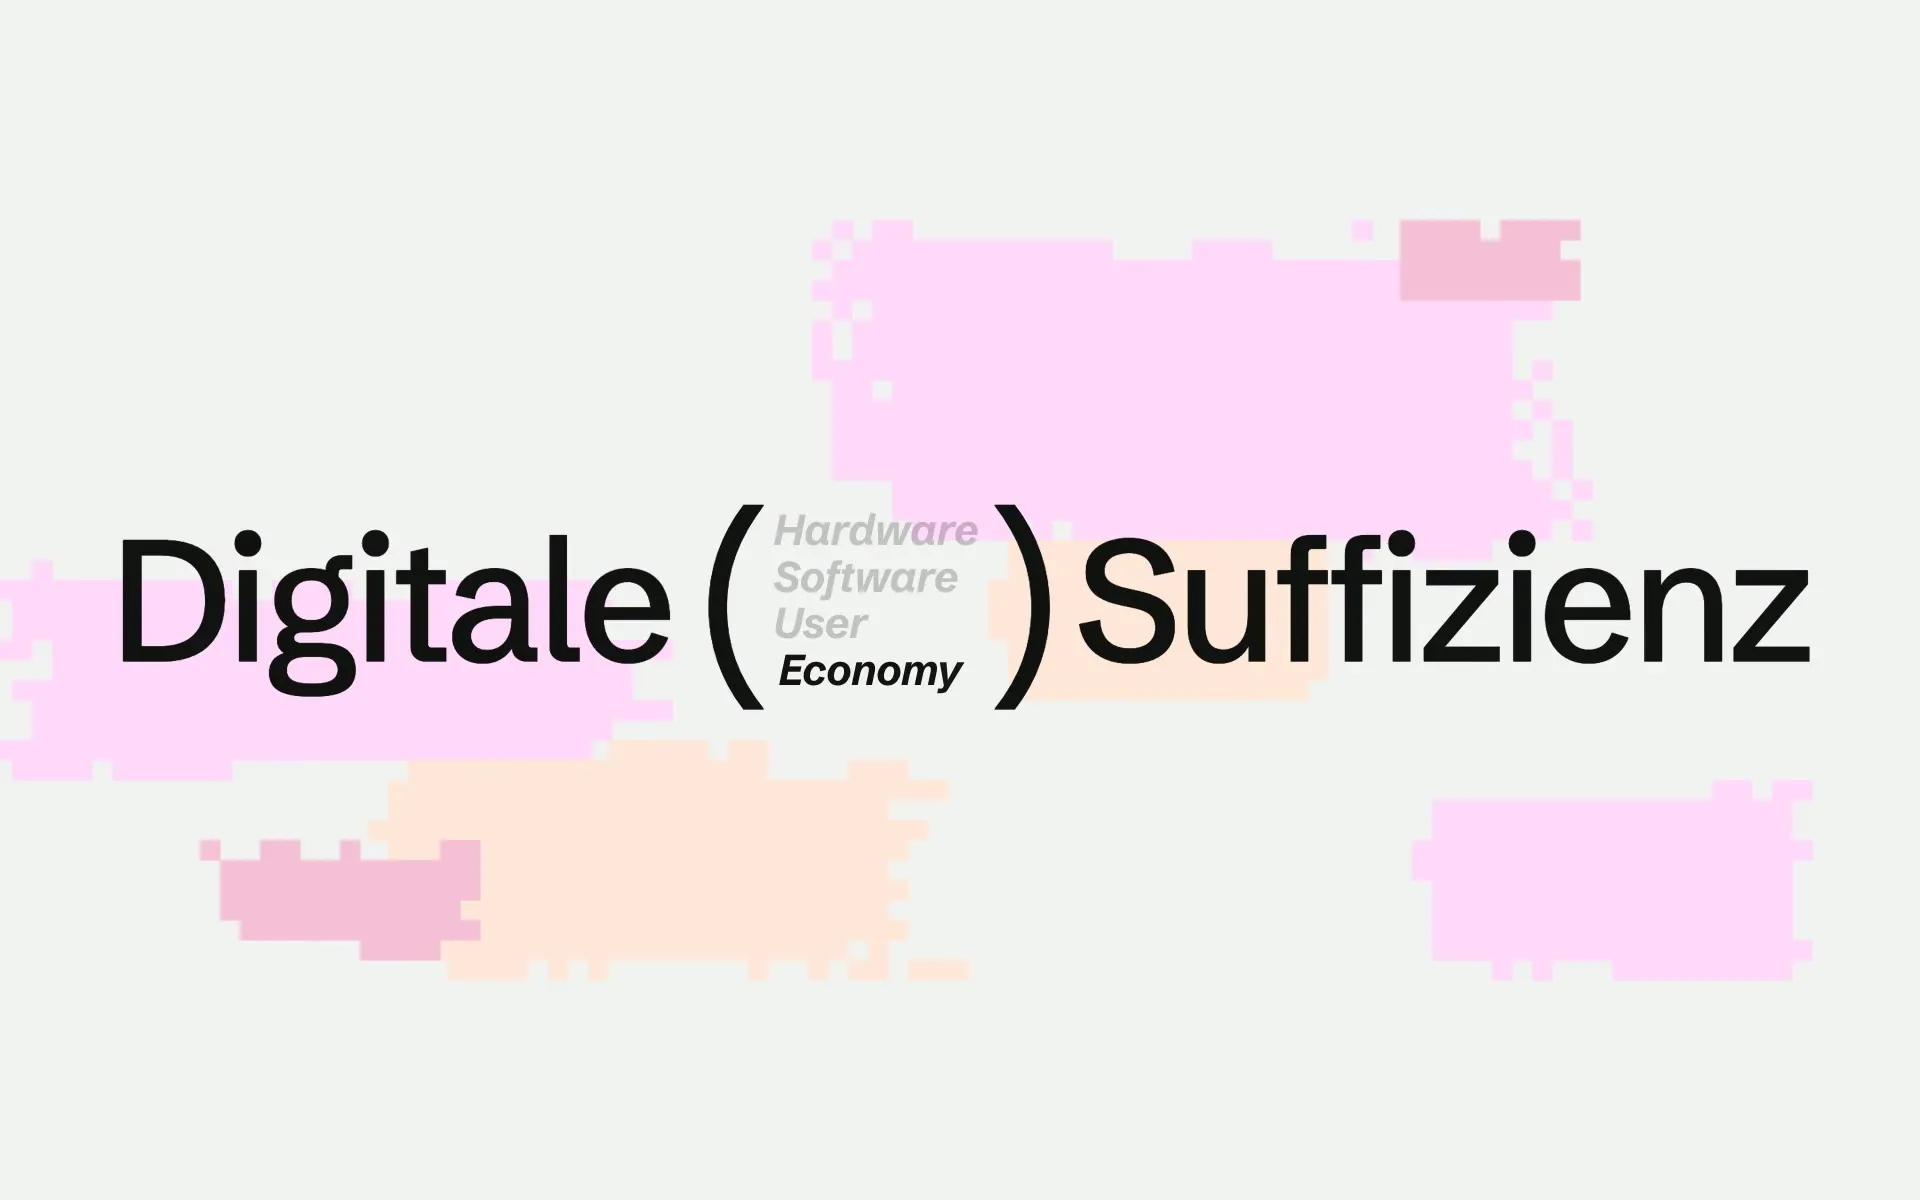
A knowledge platform that shows why “enough” is good in the digital world too – with data you can see and feel.
Case
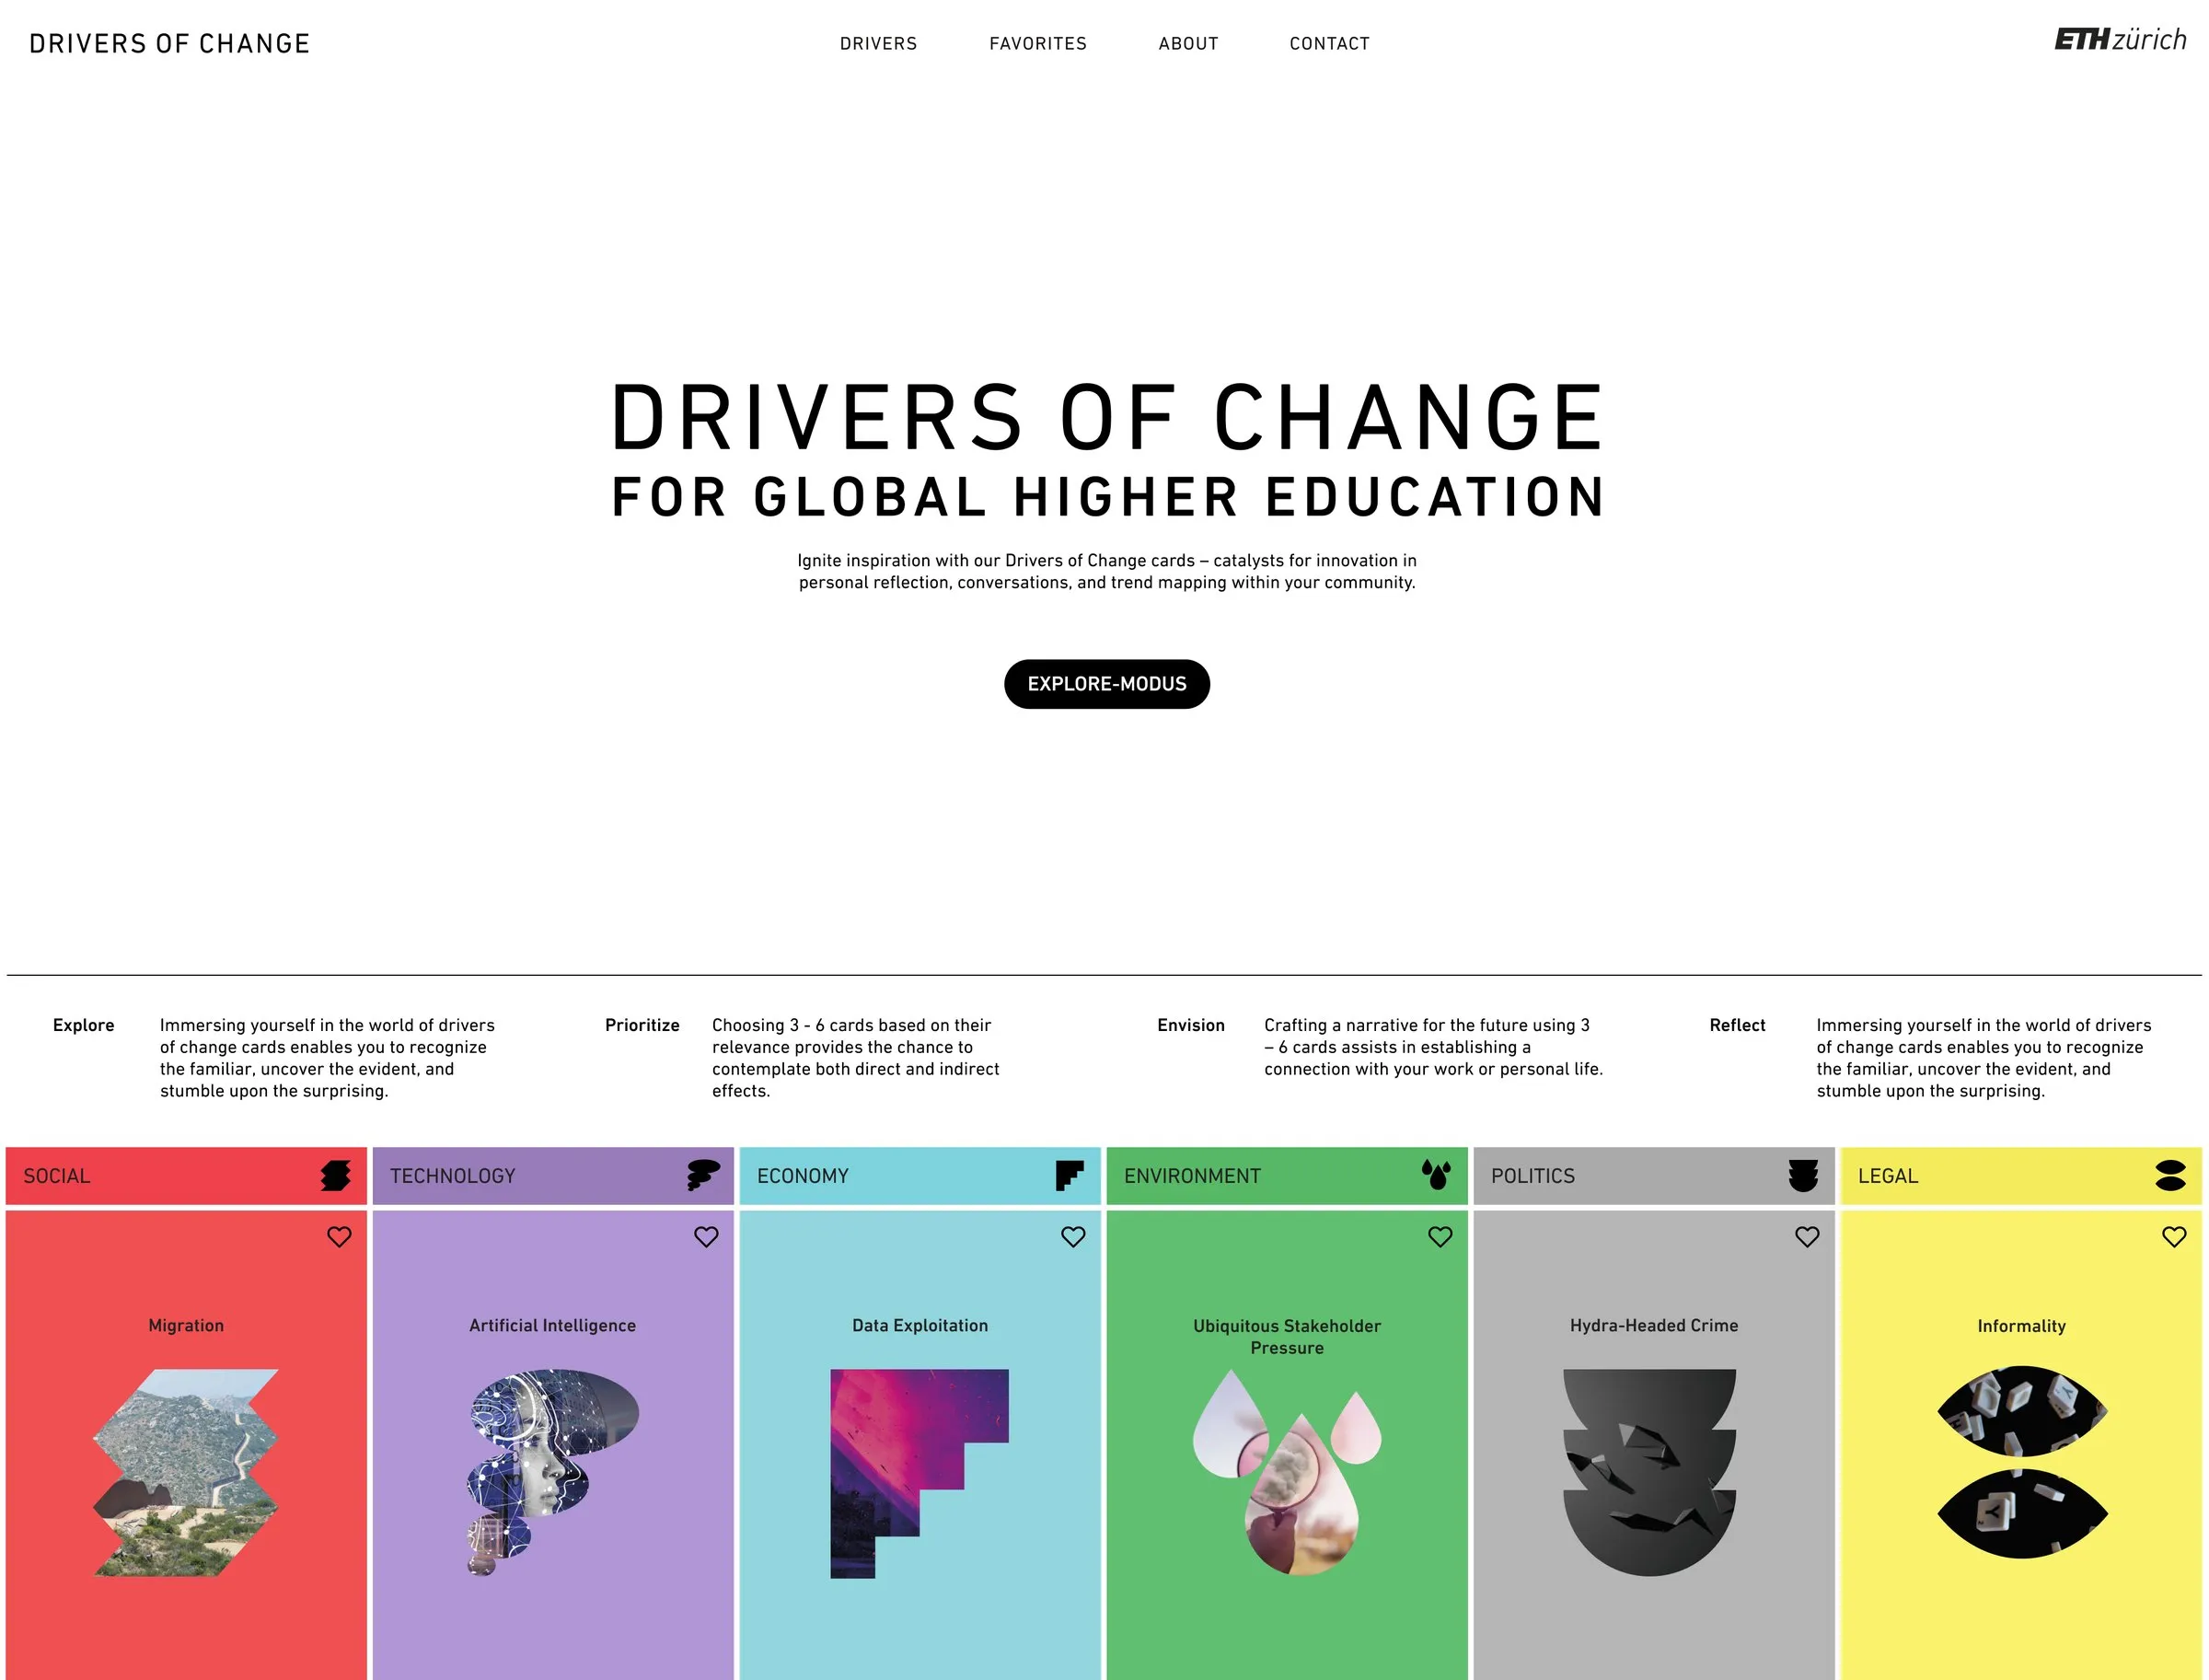
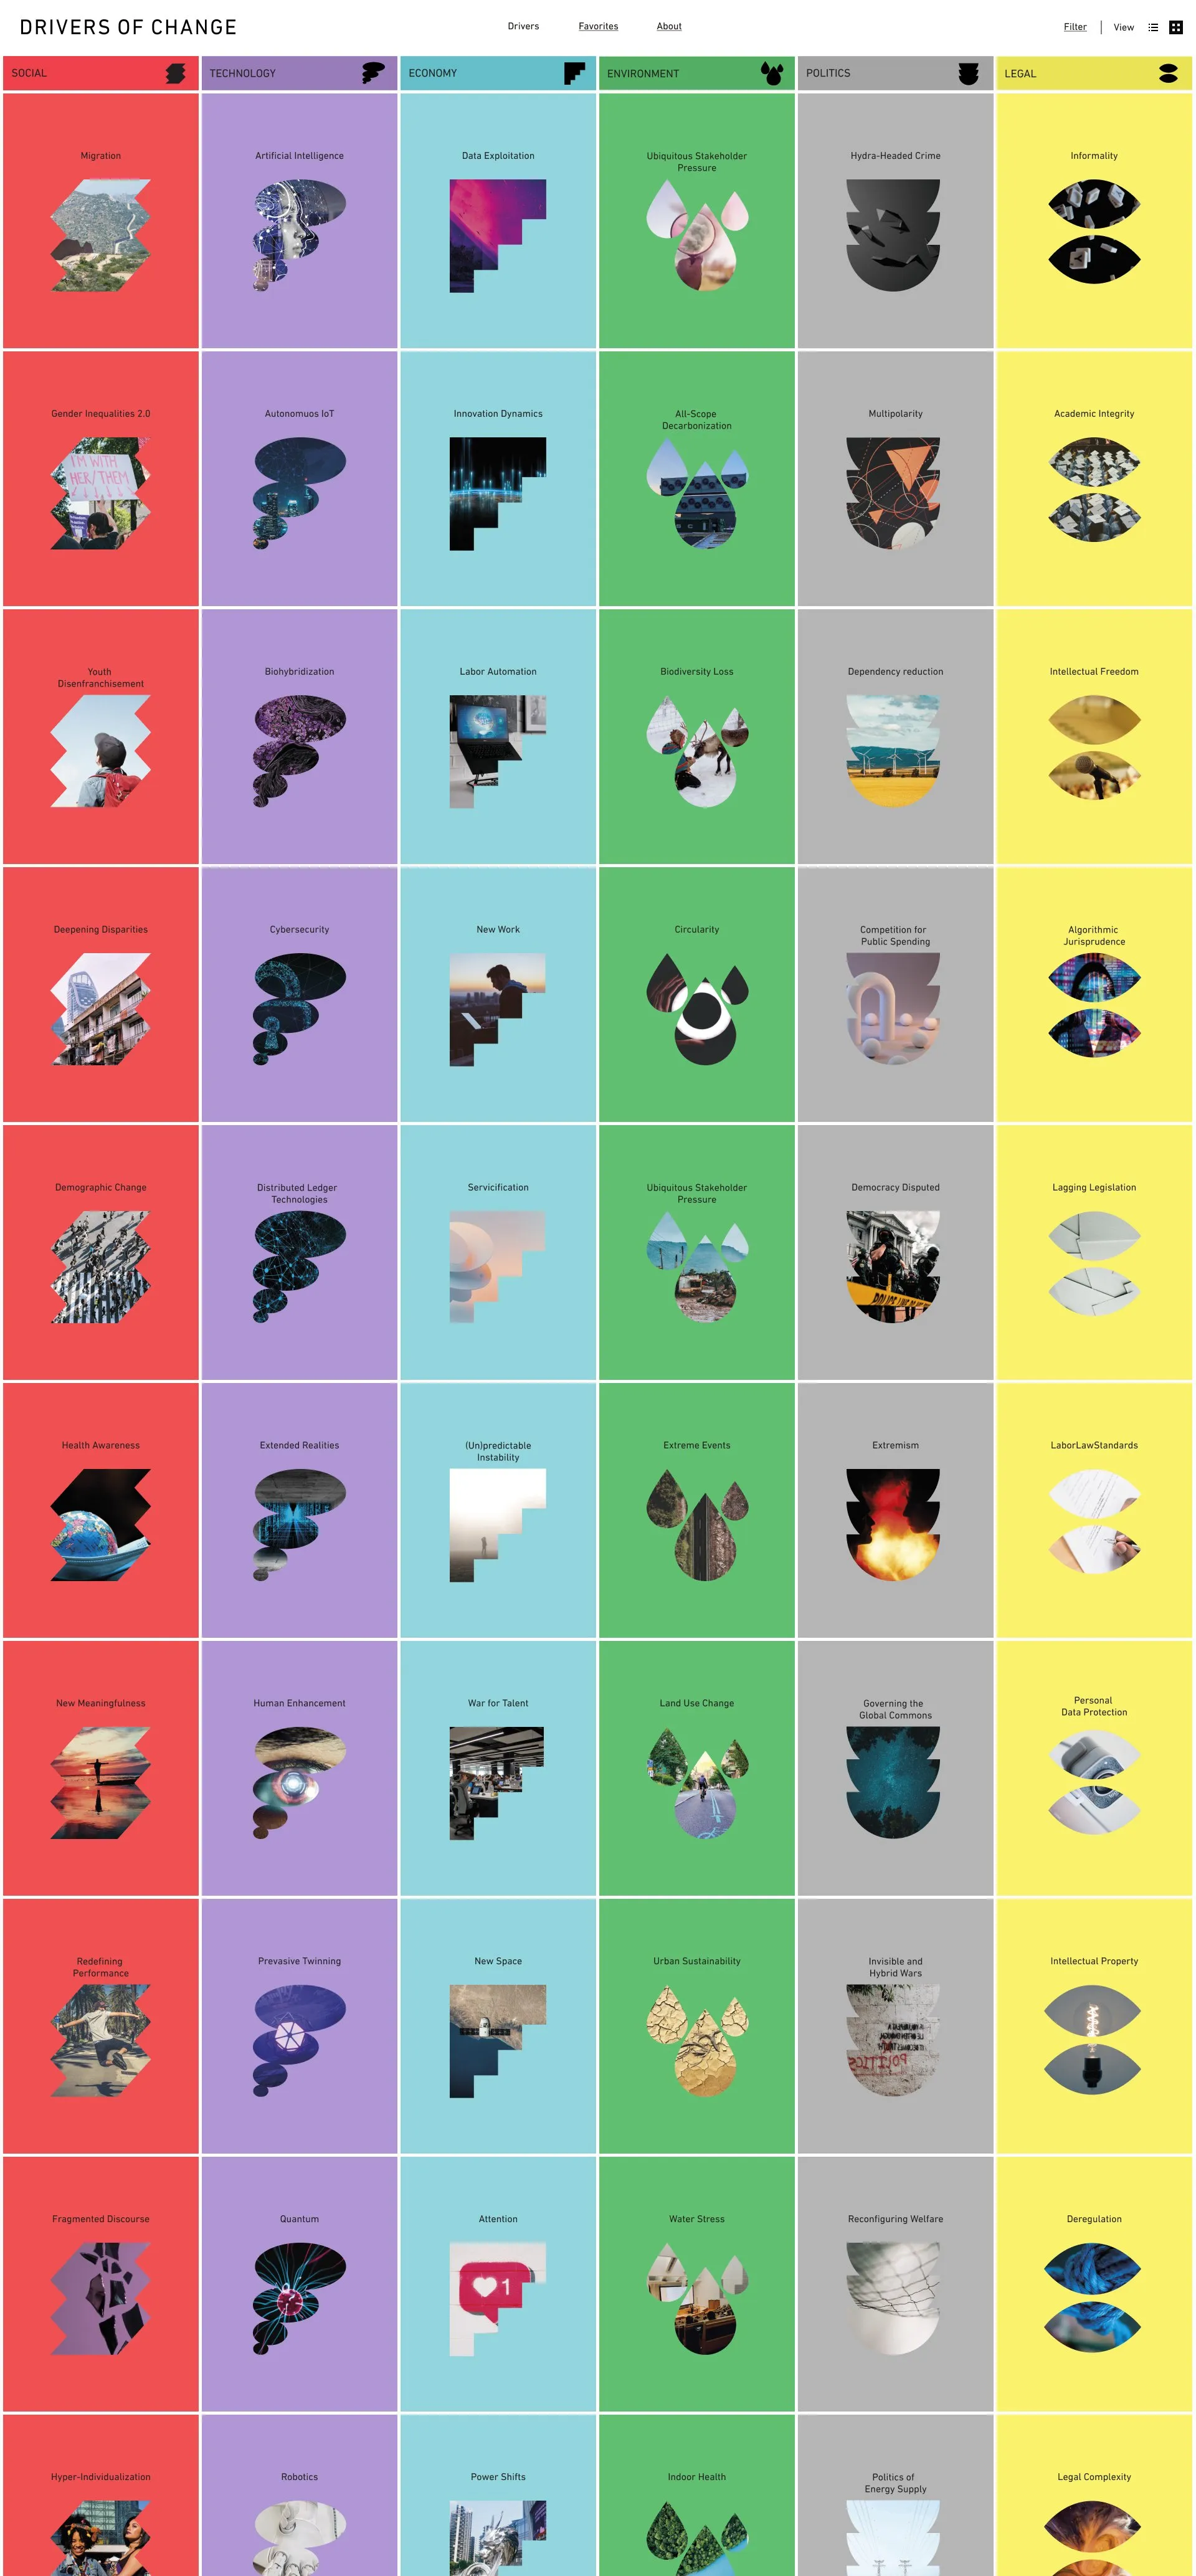
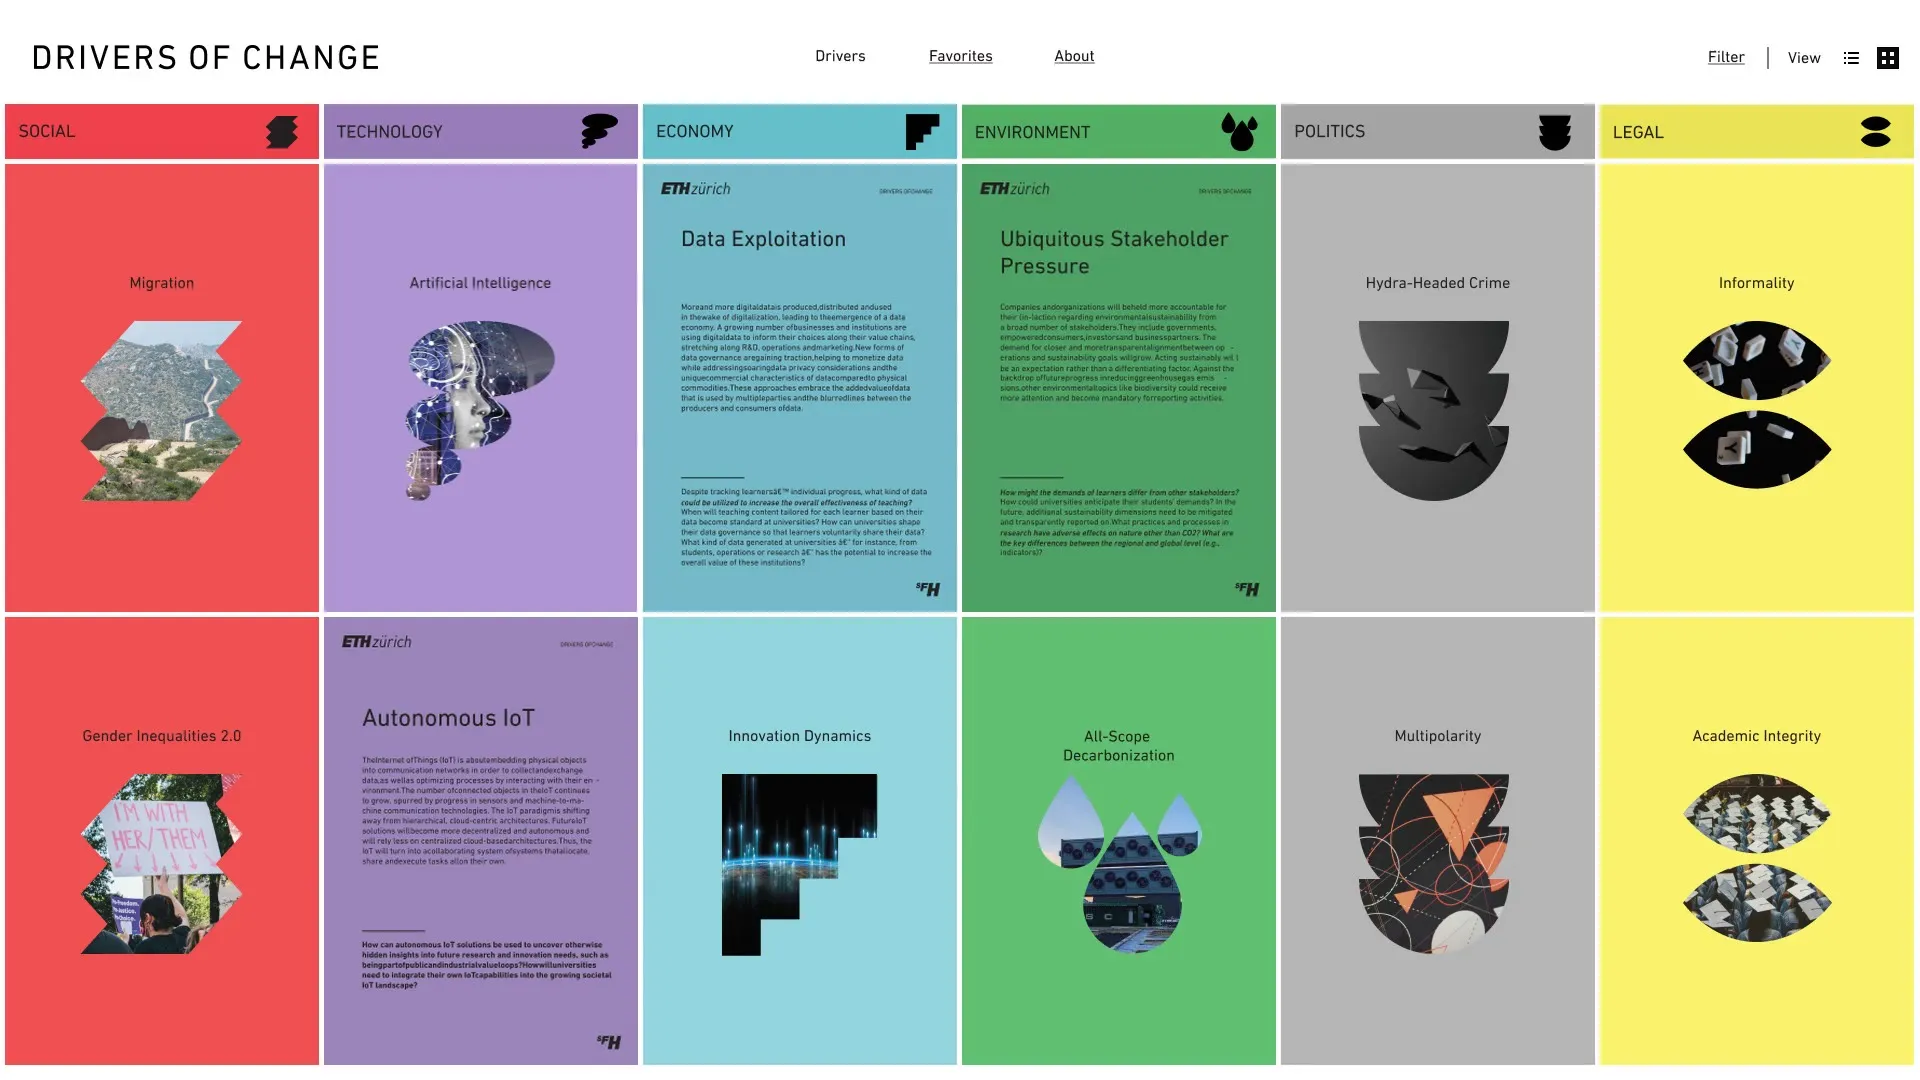
Website for the “Drivers of Change for Global Higher Education” by ETH Zurich’s Strategic Foresight Hub: 60 drivers of change as a colourful card deck on the web.
Slides from presentations of these projects
Tell me about your report or publication: who is it for, and what should stick?